What is C3?
C3 [1] is D3js-based reusable chart library. For anyone versed in drawing complex graphs on the web with interaction and animations, there are basically 2 options:
- Make a flash application (not so safe, not SEO friendly and requires browser flash plugin working and up to date).
- Use a matured animations and charting library. Although there are alternatives (not all of them free) the free and amazing D3js library does it all.
D3js is amazing, but only for someone with high-level programming skills [2] as getting all of its elements to fall into place and show what is needed and in the expected manner will definitely take a lot of skill, creativity and time. And while it comes with a lot of free templates that can be adapted with relative ease, it can still be quite hard to use and integrate.
Why C3?
If you want the beautiful data display and animations provided by D3js but esentially just want a table (or json) – like structure for punching in data and having it work, C3 is the library for you. Built out of the box for displaying serial data, with minimal configuration and maximum impact, it showes off all the animations and nice display of D3js, with most of the configuration preset so that you only need to worry about getting the data and setting it in.
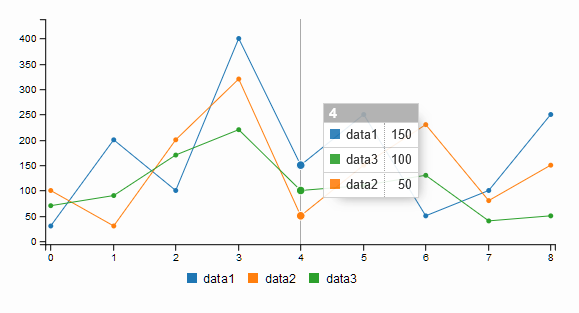
Screenshot:
Lessons
Working with C3 does not come without certain particularities. This is due to the fact that so much of d3’s functionality is preset that not all situations have been accounted for.
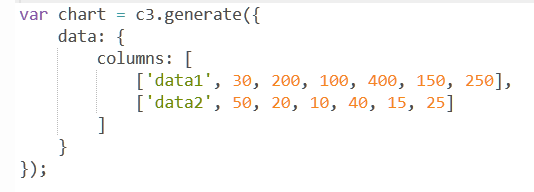
1. Data Format
Data format structure follows what one would expect to find in an excel spreadsheet. Organizing data into columns, each column with multiple row values. Data can be updated, changed or removed, C3 will take care of doing these operations animated and user-friendly.
Example:
2. Canvas size
C3 is drawing the canvas within the html container element of your choosing. That being said, it handles all sized, expections, window resize with redrawing and rescaling, hiding and showing as needed, ready to look nice from the narrow mobile screen to a wide desktop display.
To that end, one must make sure that the container element is visible and with set dimensions. Otherwise C3 will not generate correctly or at all. Elements will overlap and jump even out of page.
Why is this important? Most data services these days display their information after an ajax call for data. This means that the page is rendered with an empty graph. If one decides to show a loader instead of the graph itself, then C3 will draw the graph very poorly (if at all) since it’s container element is hidden due to loader being displayed in its place.
One of the shortcomings of C3 (and probably the only one) is that the container elements must be present, displayed and sized correctly for the data display to take place.
[1] http://c3js.org/
[2] https://www.quora.com/What-are-the-data-visualization-alternatives-to-D3-js