
JProfiler is a modern and very useful Java tool for analyzing data. It’s dedicated to analyze J2EE, J2SE projects, and can integrate a number of IDE. An equivalent profiler for NetBeans is Jfluid Technology.
JProfiler’s interface is user friendly and very fast in achieving the goal that came from the need to use an analyzing tool, which is, to show the performance statistics about the selected application and the possible leaks.
Current version is 6.0.3 and can be used as a free trial for a determined amount of time.
JProfiler offers a lot of features for an analyst/tester/programmer such as: can detect out the memory overflow,
memory leaks,show the count and size of variables from the application etc.
By default the tool does not track the creation of all objects, thus the count of them is updated as the application is used. It can also keep statistics on Garbage Collected(GC) objects and in the view can be chosen to see only live objects or GC objects or both .
For the non recorded objects, JProfiler does not know about the class name and so, the monitor views and graphs are influenced.
To recognize a memory leak in the application go to “VM Telemetry Views” and if there are linear stripes, then it means that in the application some instances use a lot of memory.
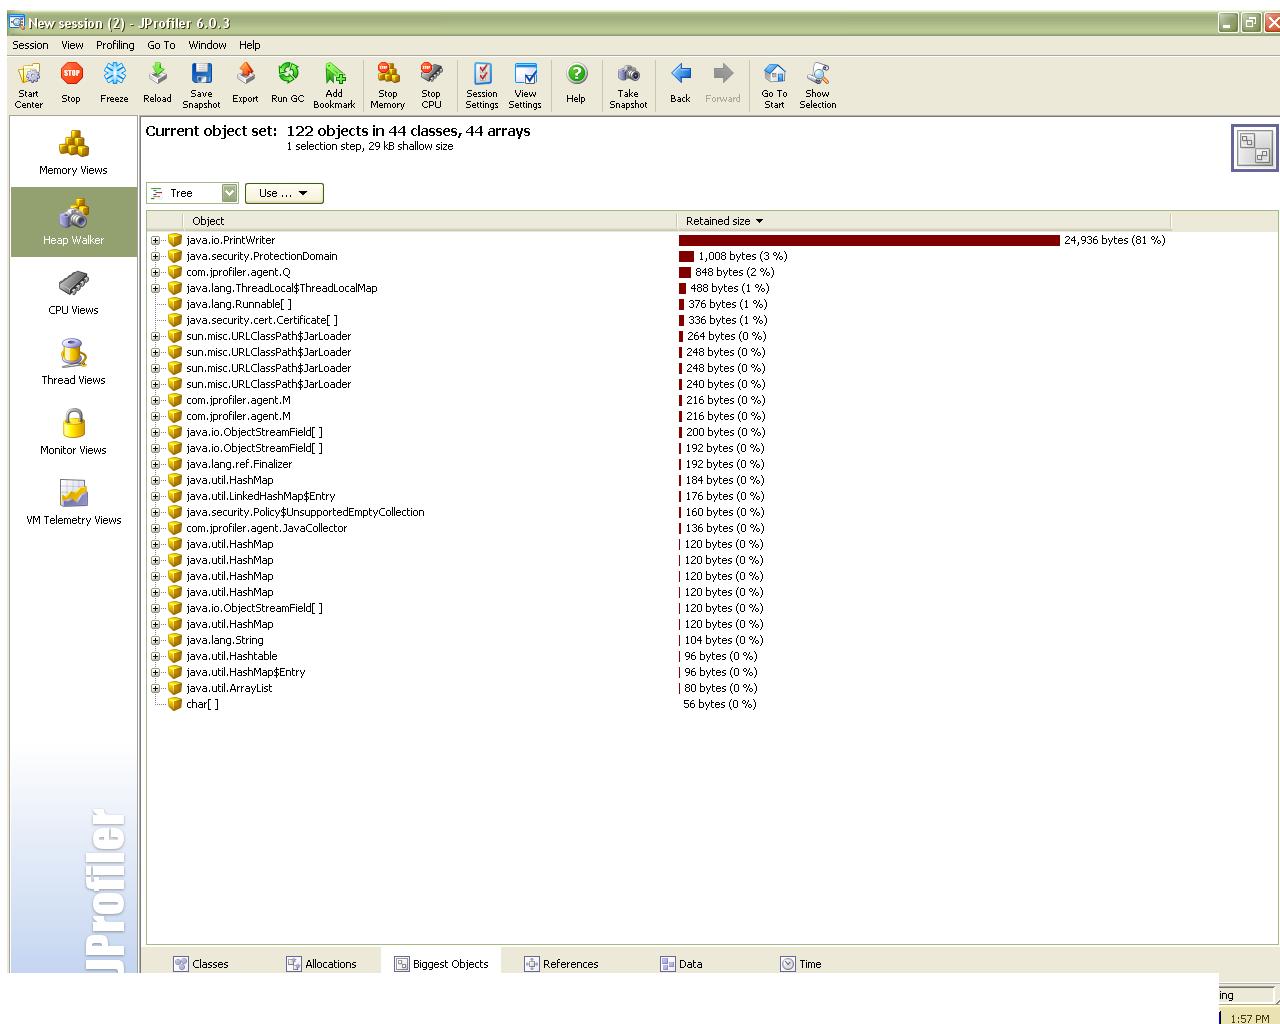
If at the start you have a decent count of instances and on executing a command the number goes though the roof, then there is a “time bomb” problem. It will crack and it all depends on when. An optimization is in order, try to reduce the number of instances, size. Maybe some objects that are kept alive should be freed by the GC. To detect these objects you can go to “Heap Walker->Biggest Objects” and see for yourself the tree with the details. There you will have specified the packages and size. See picture below:
One of the interesting features of JProfiler is the “Heal Walker->References”. In the documentation of the tool it says “Here you can find out how single objects are referenced and why they’re not garbage collected.” Choosing an object from the (for eg) Classes tab, double clicking on the one you are interested to analyze more and a new object will be created for this. This object will contain all the allocation spots in the current object set. Now, in the References tab you are offered the option to search for paths to the GC roots. You can choose to show in the view a single root, a specified number of roots or all of them. See picture below:
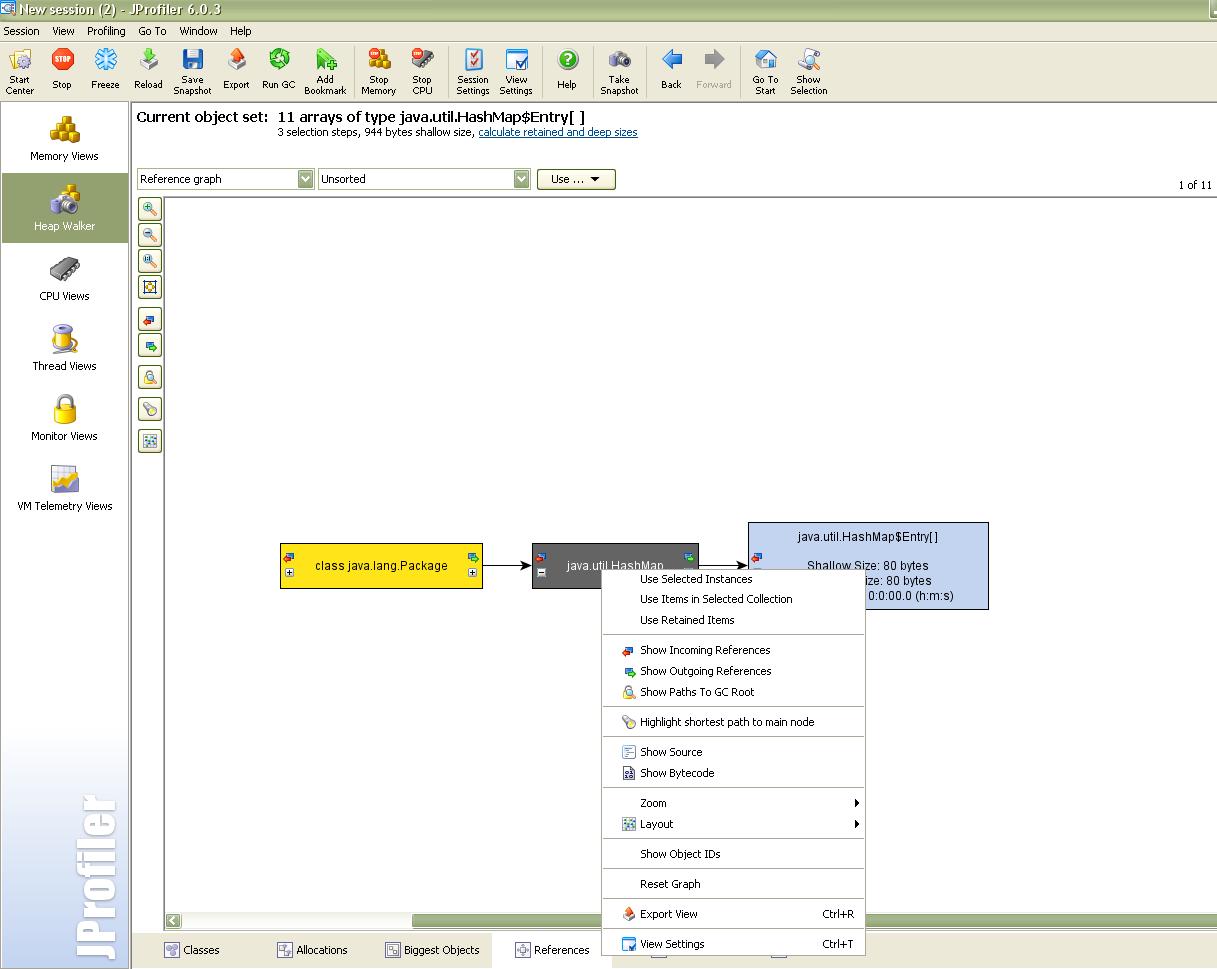
Anywhere in the shown chain can be looked for a potential memory leak.
CPU Profiling:
This type of analyze is very important. We want everything to run faster better and to use as less as possible from any type of resource.
I found this small article about CPU profiling that is used at Google(http://goog-perftools.sourceforge.net/doc/cpu_profiler.html).
Back to CPU profiling using JProfiler (the CPU usage is disabled by default) 🙂
An important feature is the wall clock time, which is the duration between the start and end of a method measured in time with a clock. Take in account that this timer is not actually the time spent by the CPU on the method. The Operating System Scheduler , the documentation states, can interrupt the execution of a method as many times as it wants and perform other tasks.
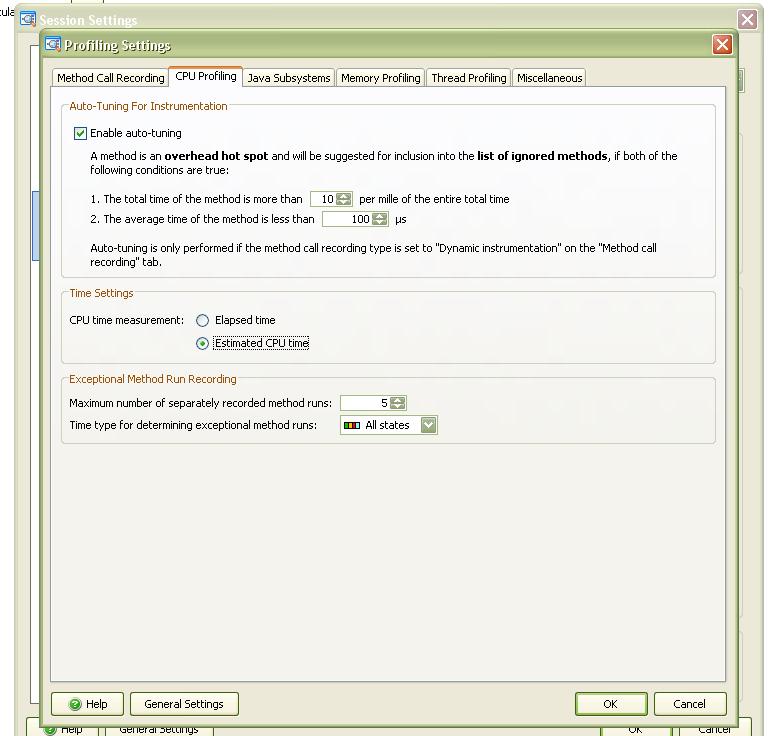
This made me wonder on how accurate is this, or how can you trust the end result of timing, but reading some more about it I found out that the actual time on the method is called CPU time. So there can be differences between CPU time and walk clock time, and remember to read the CPU time. To “enable” the CPU time(the wall clock is default) you have to edit the Profiling Settings and change the Measurement type. See picture below:
Not tested but documented, it seems that Operation Systems offer different timers with difference performance rate. “For example, on Microsoft Windows, the standard timer with a granularity of 10 milliseconds is very fast, because the operating system “caches” the current time. However, the duration of method calls can be as low as a few nanoseconds, so a high resolution timer is needed. A high resolution timer works directly with a special hardware device and carries a noticeable performance overhead.”
References:
– JProfiler official website
Finally, there’s another very important peculiarity of what does Cialis that brings it so high above its alternatives. It is the only med that is available in two versions – one intended for use on as-needed basis and one intended for daily use. As you might know, Viagra and Levitra only come in the latter of these two forms and should be consumed shortly before expected sexual activity to ensure best effect. Daily Cialis, in its turn, contains low doses of Tadalafil, which allows to build its concentration up in your system gradually over time and maintain it on acceptable levels, which, consequently, makes it possible for you to enjoy sex at any moment without having to time it.
I think you meant to say: “Analyzing” INSTEAD OF “Analizing”?
April 5, 2010 at 8:02 pmHi,
I wasn’t aware about the CPU profiling feature of JProfiler. I find it very important as well. I don’t think that I have understood very well what you have explained. Let me state first what I’ understood and then I will have a question.
Wall clock time = the actual time a CPU needs to complete a task (this is the meaning in Computer Science to the best of my knowledge; note that this definition subtly involves extra time, besides the time needed to only execute a piece of code)
By looking to your screenshot from JProfiler, I can say that: elapsed time = wall (clock) time (I prefer wall time instead of wall clock time; I think it’s more clear this way). It cannot be a “clock time” but only “actual time” (stop time – start time) because, as you have mentioned (and it is also obvious) things like I/O time, waiting for resources, context switches etc. are also measured (and I don’t think this can be avoided without hardware support).
What about “Estimated CPU time”? (don’t get me wrong but, Elapsed time is a very simple metric 🙂 ) Do you have any idea on how JProfiler tries to estimate the CPU time? I would be interested on how you can achieve such a thing by software means (is JProfiler written in Java, C/C++ or ?) and maybe you already know something about this.
April 15, 2010 at 2:50 pmThanks for best news!
July 29, 2010 at 3:31 pmthanks for great informations It’s a wonderful
July 30, 2010 at 8:42 amThanks for posting! I really enjoyed the report. I’ve already bookmark
this article.
September 16, 2010 at 6:34 am